Analytics
After following the steps in the Integration guide, and sending some request you can have a look at the analytics dashboard. Here you can see the number of executed requests and the responses of the different defenses. You can choose the time range for which you want to see the analytics and limit the results to a specific firewall or see all of them.
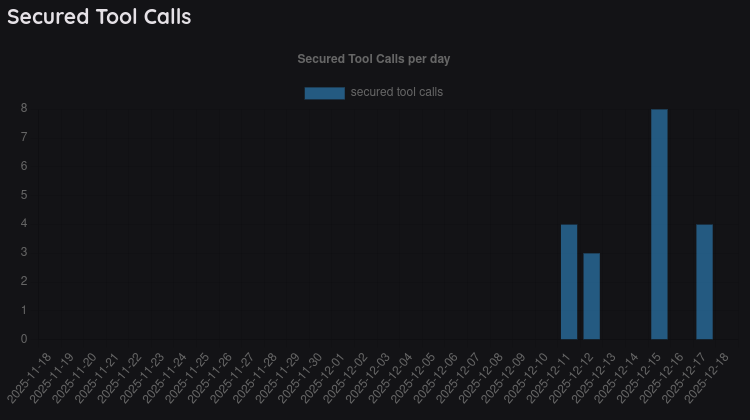
Secured Tool Calls
- make sure you have set up an agent with access to tools. Otherwise, you won't see any data here.
- the number of secured tool calls is visualized per day.
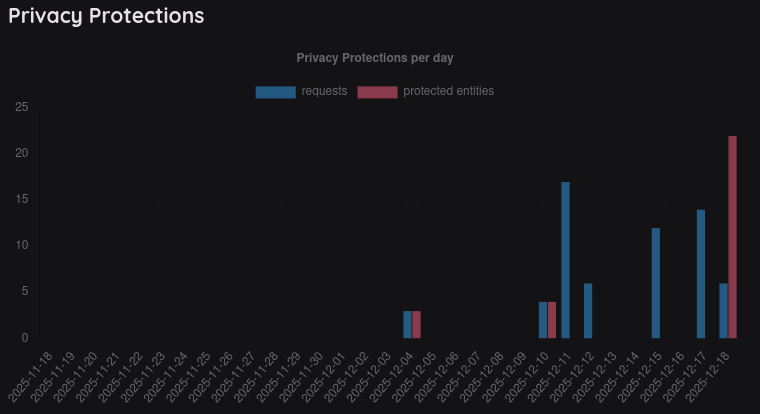
Privacy Protections
- the number of privacy protections requests is shown as the first bar.
- the second bar represents the number of actual entities (e.g. mail addresses) that were protected.
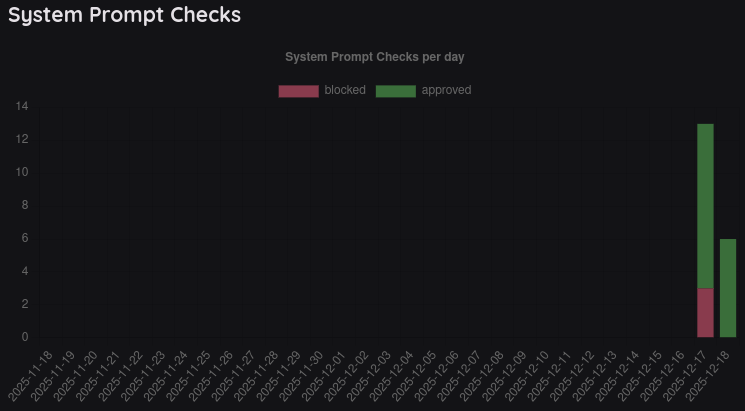
System Prompt Checks
- explore how many system prompts passed and failed the checks.
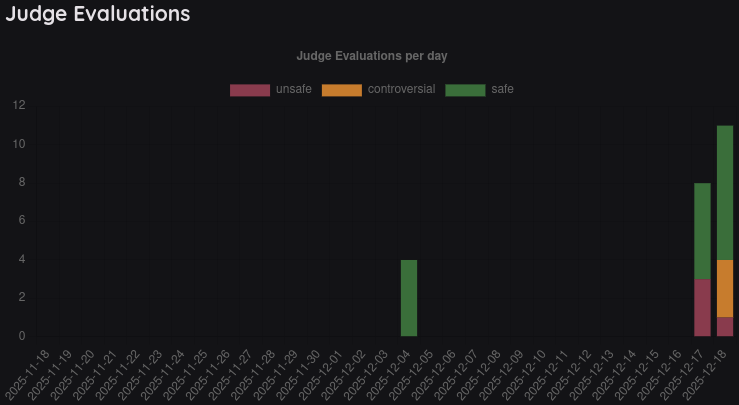
Judge Evaluations
- see how often the judge returned safe, controversial or unsafe.
- the handling of controversial results depends on the settings of the firewall.